
To thank you for being a loyal member, we want to make sure you always get a great deal on your StockCharts membership. So we've got a special offer just for you.
- - - - - - - - - - - - or - - - - - - - - - - - -
Take advantage of our best deal of the year regardless of how close or far you are from your renewal date. The additional time will be added to the end of your existing service.
There's never been a better time to renew your membership!
From simple candlesticks to advanced technical visualizations, our award-winning charting tools help you see the markets clearly.
- - - - - - - - - - - - or - - - - - - - - - - - -
Our rich feature set provides comprehensive coverage for every step of your investing journey.
Get access to the web's best technical analysis tools at the lowest price of the year!
Whether you're an active trader, diligent investor or simply managing your retirement accounts, StockCharts has everything you need to plan, organize, and execute any investing system.
Visualize market data in candlestick charts, Market Summary reports, PerfCharts, Relative Rotational Graphs, Market Carpets, PnFs, Seasonal charts, and so many more.
Set up customizable market scans and automatic real-time alerts
Utilize advanced financial charting to customizable market screens and automatic real-time alerts
Get automatic real-time alerts
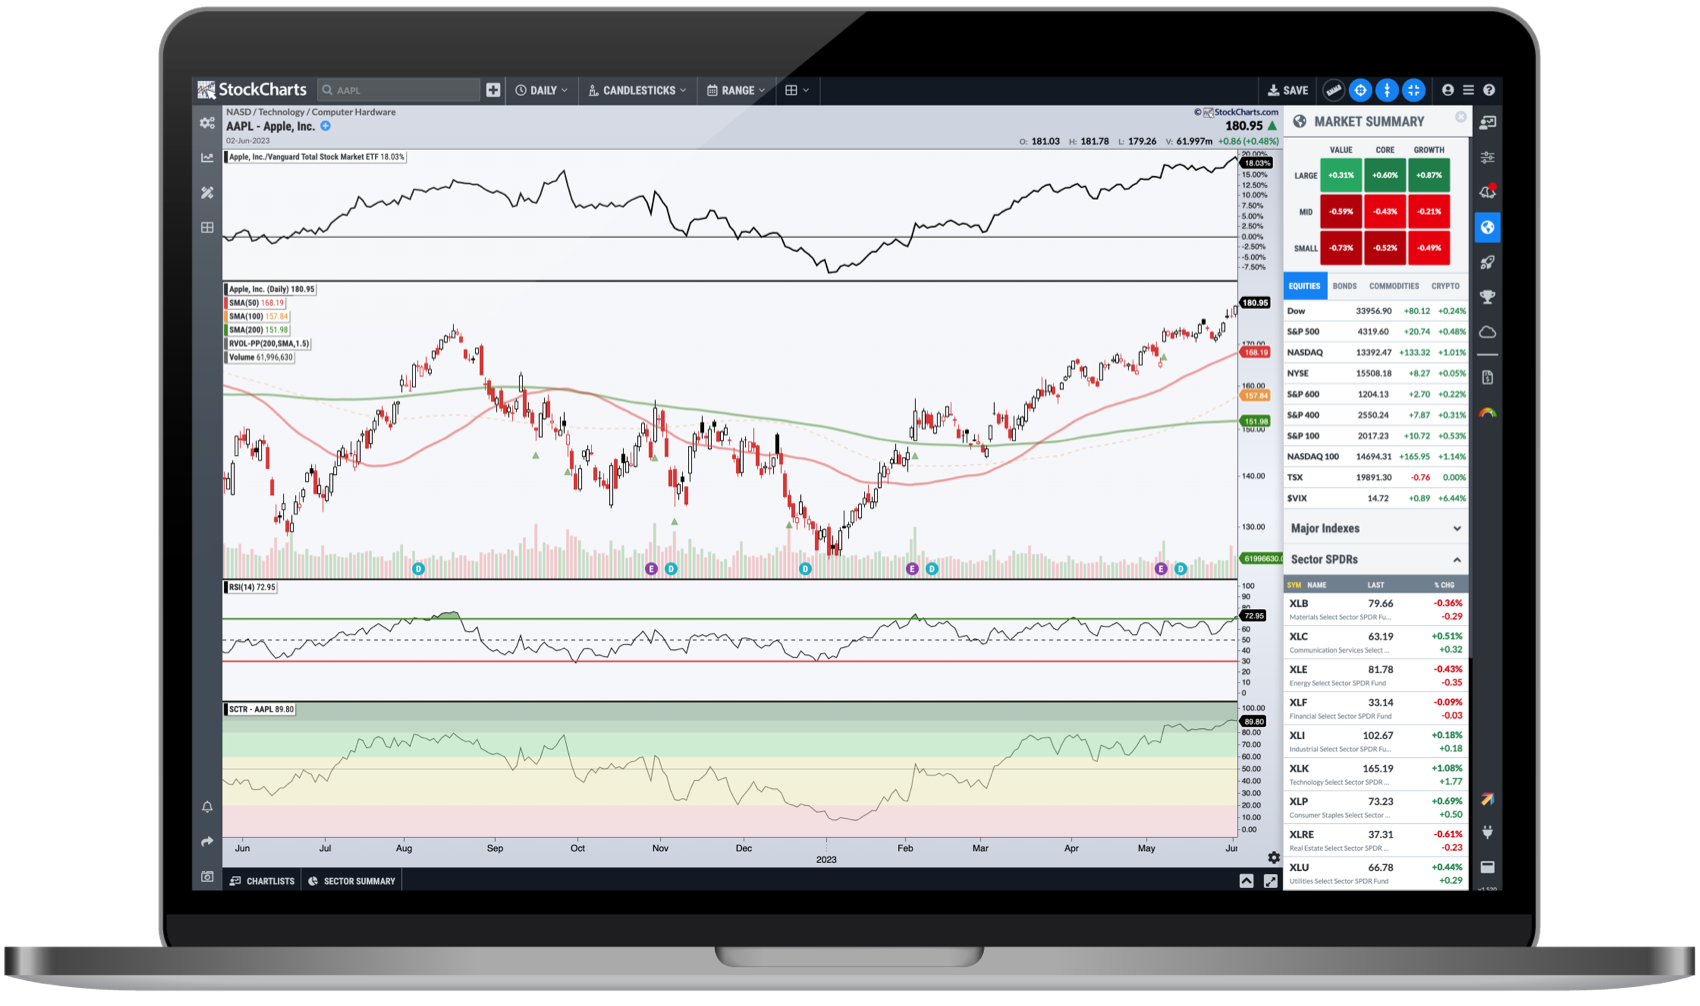
Whether you're watching the broader markets or tracking an individual stock, our unique range of charting tools and analysis resources will give you the advantage you need to stay ahead of the curve.
Monitor portfolios like never before. Save and organize the charts you're watching in custom ChartLists. Plus, access everything from all your devices to make managing your investments a breeze.
Find promising new investment opportunities quickly with our scanning and alert features. Scan thousands of symbols in seconds to find stocks and funds that fit your specific technical criteria.

From advanced financial charting to customizable market screens and automatic real-time alerts, StockCharts brings you a complete analysis and portfolio management toolkit.
Create, annotate, save, and share advanced financial charts with our award-winning technical charting tool.
Dynamically compare the performance of up to 12 different ticker symbols on the same chart.
See monthly price performance trends for the stocks or funds you're watching over an adjustable time period.
View all the charts in any of your saved ChartLists all at once as mini-charts displayed side-by-side on a single page.
Chart relative strength and momentum for a group of securities, tracking their rotations to find important pivot points.
Visually scan large groups of securities or your ChartLists to catch emerging trends and interesting technical moves.
Drill down into the market's sectors to quickly find the industry groups and stocks that are outperforming.
Quickly and easily determine a stock or fund's relative strength with our unique technical ranking system.
Access our extensive set of predefined technical scans, making it easy to filter the market for promising opportunities.
See what's moving the markets and find important charts to watch by following our predefined technical alerts.
Create your own personal stock indexes, then chart that data on a SharpChart just like any other official index.
Start charting like a pro by adding these helpful, pre-formatted ChartLists to your account in just a few clicks.
Provides me a way to find excellent setups with terrific risk-reward...
"I have learned a lot over the past 5 years and have carved out a style of trading that is within my risk threshold and provides me a way to find excellent setups with terrific risk-reward. I owe StockCharts a debt of gratitude for building such a robust system... Thanks again!"
The best platform to get ultra-dynamic and highly interactive stock charts.
"We really appreciate the StockCharts team for providing the best platform to get ultra-dynamic and highly interactive stock charts, where we can easily design charts and analyze them. StockCharts is highly interactive and the software is insanely flexible with remarkable performance."
So detailed that it will make you fall in love
"The amount of charts covered under Charts & Tools section is so detailed that it will make you fall in love with them. Very much intuitive and graphically attractive."
Superb charting software
"As a veteran financial advisor for Edward Jones, I have used your superb charting software to analyze client stock positions, track market internals, and use your charts during client reviews to display tactical buy/sell recommendations. Thank you for all you and (your team) do."

